Atomic emission spectrum of hydrogen. Studying the spectrum of the hydrogen atom Studying the spectrum of the hydrogen atom
Send your good work in the knowledge base is simple. Use the form below
Students, graduate students, young scientists who use the knowledge base in their studies and work will be very grateful to you.
LABORATORYJOB
STUDYING THE SPECTRUM OF THE HYDROGEN ATOM
1. TARGETWORKS
1.1 Study the spectrum of atomic hydrogen in the visible region of the spectrum and measure the wavelengths of hydrogen lines N b, N V, N G, N d .
1.2 Calculate the value of the Rydberg constant.
1.3 According to the found value R calculate Planck's constant h.
2. RANGEHYDROGENANDENERGYLEVELS
2.1 ExperimentsRutherford.Structureatom
Posted on http://www.allbest.ru/
In 1910, Rutherford and his collaborators conducted a series of experiments to observe the scattering of alpha particles as they passed through thin metal foil. The experiment was carried out as follows (Fig. 1). A beam of alpha particles emitted by a radioactive source released through a narrow hole in a container AND, fell on a thin metal foil F. When passing through the foil, alpha particles deviated from their original direction of motion at various angles. Scattered alpha particles hit the screen E, coated with zinc sulphide, and the scintillations (flashes of light) they caused were observed under a microscope M. The microscope and screen could be rotated around an axis passing through the center of the foil, and thus installed at any angle. The entire apparatus was placed in a vacuum chamber to eliminate the scattering of alpha particles by collision with air molecules.
Observations have shown that the bulk of alpha particles deviate from the original direction only by small angles, but at the same time, the scattering angle of a small number of alpha particles turns out to be significantly large and can even reach 180 o. After analyzing the results of the experiment, Rutherford came to the conclusion that such a strong deviation of alpha particles from the original direction is possible only if there is an extremely strong electric field inside the atom, which is created by a charge associated with a large mass. The small fraction of particles scattered at large angles indicates that the positive charge and associated mass are concentrated in a very small volume and the likelihood of a direct hit is low. Based on this conclusion, Rutherford proposed a nuclear model of the atom in 1911. According to Rutherford, an atom is a system of charges, in the center of which there is a heavy positively charged nucleus, having dimensions not exceeding 10 -12 cm, and negatively charged electrons rotate around the nucleus (so as not to fall on the nucleus), the total charge of which is equal in magnitude to the charge of the nucleus . Almost all the mass of an atom is concentrated in the nucleus.
However, the nuclear model turned out to be in conflict with the laws of classical mechanics and electrodynamics. The essence of the contradiction is as follows: an electron, moving along a curved path, must have centripetal acceleration. According to the laws of classical electrodynamics, a charge moving with acceleration must continuously emit electromagnetic waves. The process of radiation is accompanied by a loss of energy, so that the electron (if you follow the classical laws) should gradually descend, moving in a spiral and, ultimately, fall onto the nucleus. Estimates have shown that the time after which an electron must fall onto the nucleus should be approximately 10 -8 s. At the same time, continuously changing the radius of its orbit, it should emit a continuous spectrum, while in experiments with rarefied gases it was established that the spectra of atoms are lined. Thus, a contradiction arose between the ideas about the atom resulting from the results of Rutherford’s experiments and the laws of classical physics, according to which an atom having the indicated structure must be unstable, and its radiation spectrum must be continuous
2.2 PostulatesBora.ElementaryBorovskayatheoryhydrogendnogoatom
A way out of the contradiction that arose between the laws of classical physics and the conclusions arising from the results of Rutherford's experiments was proposed by Niels Bohr, who in 1913 formulated the following postulates: Postulate - a statement accepted without proof, as an axiom. The validity of a particular postulate can be judged by comparing the results obtained when using a particular postulate with experiment. :
1) Of the infinite number of electron orbits possible for an electron in an atom from the point of view of classical mechanics, only a few, called stationary. While on stationary orbit electron Not emits energy (Em waves) Although And moves With acceleration. For a stationary orbit, the angular momentum of the electron must be an integer multiple of the constant value
(-Dirac constant).
Those. the following ratio must be satisfied:
Where m e- electron mass, v-electron speed, r - electron orbit radius, n- an integer that can take the values 1, 2, 3, 4... and is called the principal quantum number.
2) Radiation is emitted or absorbed by an atom in the form of a light quantum of energy during the transition of an electron from one stationary (stable) state to another. The magnitude of the light quantum is equal to the difference in energies of those stationary states E n 1 And E n 2 , between which a quantum jump of an electron occurs:
The same relationship is valid for the case of absorption. Relationship (2) is called rulefrequenciesBora.
2.3 ModelBoraatomhydrogen
Bohr based the model of the hydrogen atom on the planetary model of the Rutherford atom and the postulates already mentioned above. From Bohr's first postulate it follows that only such orbits of motion of an electron around a nucleus are possible for which the angular momentum of the electron is equal to an integer multiple of the Dirac constant (see (1)). Bohr then applied the laws of classical physics. In accordance with Newton's second law, for an electron rotating around a nucleus, the Coulomb force plays the role of a centripetal force and the following relation must be satisfied:
excluding the speed from equations (1) and (3), an expression was obtained for the radii of permissible orbits:
Here n - principal quantum number ( n = 1,2,3…
The radius of the first orbit of a hydrogen atom is called Borovskyfor the sake ofatsom and is equal
The internal energy of an atom is equal to the sum of the kinetic energy of the electron and the potential energy of interaction between the electron and the nucleus (the nucleus, due to its large mass, is considered to be motionless to a first approximation).
So as (see formula (3))
Substituting into (6) the expression r n from (4), we find the allowed values of the internal energy of the atom:
Where n = 1, 2, 3, 4…
When a hydrogen atom transitions from the state n 1 in a state n 2 a photon is emitted.
The inverse wavelength of the emitted light can be calculated using the formula:
2.4 PatternsVatomicspectra
When conducting experimental studies of the emission spectra of hydrogen, Balmer found that hydrogen atoms (like atoms of other elements) emit electromagnetic waves of strictly defined frequencies. Moreover, it turned out that the reciprocal of the wavelength of the spectral line can be calculated as the difference of some two quantities, which are called spectral terms, i.e. the following ratio is valid:
Quantitative processing of experimentally obtained hydrogen spectra showed that the terms can be written as follows:
Where R is the Rydberg constant, and n is an integer that can take a number of integer values 1,2,3... The value of the Rydberg constant obtained experimentally was:
Taking into account the above, the wavelength of any spectral line of hydrogen can be calculated from generalizedformulaBalmera:
where are the numbers n 1 And n 2 can take values: n 1 = 1,2,3...; n 2 = n 1 , n 1 +1, n 1 +2 …
The wavelengths calculated using formula (15) very accurately coincided with the experimentally measured wavelengths in the hydrogen emission spectrum.
Comparing formulas (11) and (15), we can conclude that formula (11) is the same generalized Balmer formula, but obtained theoretically. Therefore, the value of the Rydberg constant can be calculated using the formula:
Numbers n 1 , n 2 - these are quantum numbers, which are the numbers of stationary orbits between which a quantum jump of an electron occurs. If you measure the value of the Rydberg constant experimentally, then using relation (16) you can calculate the Planck constant h.
atomic hydrogen boron rydberg
3. METHODOLOGYPERFORMANCEWORKS
3.1 Workersformulas
Rangeradiation is an important characteristic of a substance, which makes it possible to establish its composition, some characteristics of its structure, and the properties of atoms and molecules.
Gases in the atomic state emit line spectra, which can be divided into spectral series.A spectral series is a set of spectral lines for which the quantum number n 1 (the number of the level to which transitions are made from all higher levels) has the same meaning. The simplest spectrum is that of the hydrogen atom. The wavelengths of its spectral lines are determined by the Balmer formula (15) or (11).
Each series of the spectrum of a hydrogen atom has its own specific value. n 1 . Values n 2 represent a sequential series of integers from n 1 +1 to?. Number n 1 represents the number of the energy level of the atom to which the electron transitions after radiation; n 2 - the number of the level from which an electron passes when an atom emits electromagnetic energy.
According to formula (15 ), The hydrogen emission spectrum can be represented in the form of the following series (see Fig. 2):
Series Lyman (n 1 =1) - ultraviolet part of the spectrum:
Series Balmera (n 1 = 2) - visible part of the spectrum:
Fig. 2. Series of the spectrum of the hydrogen atom
a) energy diagram, b) transition diagram, c) wavelength scale.
Series Pashen (n 1 = 3) - infrared part of the spectrum:
Series Bracket (n 1 = 4) - infrared part of the spectrum:
Series Pfunda(n 1 = 5) - infrared part of the spectrum:
In this paper, we study the first four lines of the Balmer series, corresponding to transitions to the level n 1 = 2. Magnitude n 2 for the first four lines of this series, lying in the visible region, takes values 3, 4, 5, 6. These lines have the following designations:
H b- Red line ( n 2 = 3),
H V- green-blue ( n 2 = 4),
H n- blue( n 2 = 5),
H d- purple ( n 2 = 6).
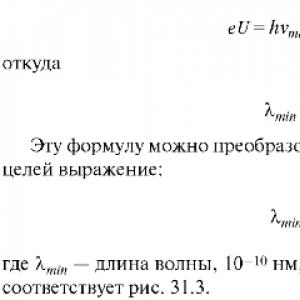
The experimental determination of the Rydberg constant using lines of the Balmer series can be carried out using the formula obtained on the basis of (15):
The expression for calculating Planck's constant can be obtained by transforming formula (16):
Where m = 9.1 ? 10 -31 kg,e - 1.6 ? 10 -19 Kl,C - 3 ? 10 8 m/With,e 0 =8.8 ? 10 -12 f/ m.
3.2 Conclusionformulascalculationerrors
The expression for calculating the absolute measurement error of the Rydberg constant DR can be obtained by differentiating formula (17). It should be taken into account that the values of quantum numbers n 1 , n 2 are exact and their differentials are zero.
Fig.3. Finding the error DC according to the calibration schedule
The magnitude of the absolute error in determining the wavelength l can be found using a calibration graph of wavelength versus drum division l (ts) (see Fig. 2) . To do this, it is necessary to estimate the error in taking a reading on the drum DC and, as shown in Fig. 3, find the corresponding error Dl at a given wavelength.
However, due to the fact that the values ? are very small, then with the existing scale of the graph l = f(ts) it is not possible to determine the value Dl. That's why Dl is determined with sufficient accuracy using formula (24).
To determine Planck's constant, tabular values of quantities are used m e, e, e 0, C, which are known with an accuracy significantly exceeding the accuracy of determining the Rydberg constant, therefore the relative error in determining h will be equal to:
Where DR- error in determining the Rydberg constant.
3.3 Descriptionlaboratoryinstallations
The light source, in the visible part of the spectrum of which the lines of atomic hydrogen predominate, is an H-shaped glow discharge lamp, powered by a high-voltage rectifier 12. The highest brightness of the spectrum is achieved when the end of the horizontal part of the tube (capillary) serves as the light source.
To measure the wavelengths of spectral lines, a prism monochromator UM-2 is used in this work (Fig. 4). In front of the entrance slit of the monochromator, a hydrogen lamp S and a condenser K move on the optical rail on riders; the condenser serves to concentrate light on the entrance slit of the monochromator (1).
The entrance slot 1 is equipped with a micrometric screw 9, which allows you to open the slot to the desired width. The collimator lens 2 forms a parallel beam of light, which falls further onto the dispersing prism 3. The micrometric screw 8 allows you to move the lens 2 relative to the slit 1 and serves to focus the monochromator.
Fig. 4. Laboratory setup diagram.
Prism 3 is installed on a rotary table 6, which rotates around a vertical axis using a screw 7 with a counting drum. A helical track with degree divisions is applied to the drum. The direction indicator of the drum 11 slides along the track. As the drum rotates, the prism rotates, and in the center of the field of view of the telescope, consisting of a lens 4 and an eyepiece 5, various parts of the spectrum appear. Lens 4 produces an image of entrance slit 1 in its focal plane.
Pointer 10 is located in this plane. To change the brightness of the pointer illumination, there is a regulator and a switch on the monochromator.
The images of the slit produced by different wavelengths of light are spectral lines.
4. ORDERPERFORMANCEWORKS
After reading the description of the laboratory installation, turn it on in the following order:
4.1. Turn the handle "PREPARATION" clockwise until it stops, without applying excessive force.
4.2. Click the button "ON"HIGH." At this point the light will light up NET", instrument arrow "CURRENTDISCHARGE" deviate by 6...8 divisions, a hydrogen lamp discharge will occur.
4.3. Using the condenser adjustment screws, focus the light spot from the hydrogen lamp onto the crosshairs of the cap at the collimator inlet, then remove the cap.
4.4. Find the red, green-blue, blue and violet lines in the spectrum of hydrogen. This region of the spectrum is located approximately in the range of 750...3000 drum divisions. The violet line has weak intensity. Along with the lines of atomic hydrogen, lines of molecular hydrogen are observed in the spectrum of the hydrogen tube in the form of weak red-yellow, green and blue bands. They should not be confused with the clear lines of atomic hydrogen.
Rotating drum 7, align each of the lines with the eyepiece indicator and take the drum count according to indicator 11.
4.5. Repeat this operation three times for each of the four lines of the spectrum, bringing it to the eyepiece pointer from different sides. Record the measurement results (N 1 ... N 3) in table 1.
4.6. After 10 minutes the device will turn off, indicating the shutdown with a bell. If it is necessary to turn it on again, repeat the operations in paragraphs 4.1 and 4.2. To turn off the unit in an emergency, turn the knob "PREPARATION" counterclock-wise. Calculate the tabular values of drum counts for each line using formulas (21…24)
Table 1
CalculationsByresultsmeasurementsare being doneoncomputer
Calculate the tabular values of drum counts for each line using formulas (21…24)
The magnitude of the absolute error that occurs when measuring the number of divisions of the drum is determined by the formula:
The wavelength of each spectrum line can be determined from the monochromator calibration graph. However, it is easier to do this using the interpolation formula:
410.2+5.5493*10 -2 (N avg -753.3)2.060510 -7 (N avg - 753.3) 2 +
1.5700 *10 -8 (N avg -753.3) 3 (23)
The absolute error in determining each of the wavelengths can be calculated using the interpolation formula, having previously differentiated it by N CP:
d = 5.5493-10 -2 dNav- 4.121? 10 -7 (N avg - 753.3) dN avg +
4.7112?10 -8 (N c p - 753.3) 3 dN avg (24)
Now we can begin to calculate the Rydberg and Planck constants using formulas (17) and (18), respectively. The magnitude of the absolute error in determining the Rydberg constant is calculated using formula (19), and then the relative error in determining the Planck constant is calculated using formula (20).
Thus, for each of the spectral lines we obtain our own values of the Rydberg and Planck constants, which, strictly speaking, should be the same for all these lines. However, as a result of errors in wavelength measurements, these values differ slightly from each other.
To obtain a final answer about the value of the constants being determined, it is advisable to proceed as follows. Take their average value as the value of the Rydberg and Planck constants, and take the maximum of the errors as the value of the absolute error in their determination. You just need to remember that the error value is rounded to the first significant digit. The value of the constants is rounded to a figure of the same order as the error. Enter the calculation results in Table 2.
Table 2.
At the end of the calculations, write down the results of the work performed in the form:
R = (R avg ± R)?10 7 1/m
h = (h avg ± h)?10 -34 J s
5. CONTROLQUESTIONS
5.1. What experimental facts is the Bohr model of the hydrogen atom based on?
5.2. State Bohr's postulates.
5.3. What is Balmer's formula?
5.4. What is Rydberg's constant?
5.5. What is the essence of Bohr's theory of the hydrogen atom? Derive a formula for the radius of the first and subsequent Bohr orbits of an electron in a hydrogen atom.
5.6. Derive a formula for the position of electron energy levels in a hydrogen atom.
5.7. What is the energy spectrum of a hydrogen atom? Name the series of spectral lines of the hydrogen atom. What does a particular series of spectral lines of a hydrogen atom represent?
LITERATURE
I.V. Savelyev. General physics course T.3. Ed. M. “Science” 1988.
Posted on Allbest.ru
Similar documents
The idea of atoms as indivisible smallest particles. Rutherford's experiment on alpha particle scattering. Consideration of the line spectrum of the hydrogen atom. Bohr's idea about the existence of stationary states in atoms. Description of the main experiments of Frank and Hertz.
presentation, added 07/30/2015
Determination of the structure of the spectrum of an atom, molecule or macrosystem formed by them by their energy levels. Spectra and structure of the hydrogen atom. Electronic states of diatomic molecules, electrical and optical properties. Molecules with identical nuclei.
course work, added 10/06/2009
Kinetic energy of an electron. Daybrol and Compton wavelengths. Rest mass of an electron. The distance of an electron from the nucleus in an unexcited hydrogen atom. The visible region of the spectrum lines of the hydrogen atom. Mass defect and specific binding energy of deuterium.
test, added 06/12/2013
Quantum theory of Compton scattering. Direction of motion of the recoil electron. Light pressure. Serial patterns in the spectra of the hydrogen atom. Model of Thomson, Rutherford. Bohr's postulates. De Broglie's hypothesis. Elements of quantum mechanical theory.
presentation, added 01/17/2014
Classification of elementary particles. Fundamental interactions. Rutherford's model of the atom. Bohr's theory for the hydrogen atom. Hydrogen atom in quantum mechanics. Quantum mechanical substantiation of the Periodic Law of D. Mendeleev. The concept of radioactivity.
abstract, added 02/21/2010
Optical properties of semiconductors. Mechanisms of light absorption and its types. Methods for determining absorption coefficient. An example of calculating the spectral dependence of the absorption coefficient of a selectively absorbing coating in the visible and IR parts of the spectrum.
abstract, added 12/01/2010
Characteristics of an electron in stationary states. Condition for orthogonality of spherical functions. Solutions for the radial function. Scheme of energy states of the hydrogen atom and serial patterns. Corrections due to electron spin.
presentation, added 02/19/2014
The operating principle and features of using light filters, their purpose and main functions. A technique for isolating a narrow part of the spectrum using a combination of Schott filters. The order of highlighting one or more lines of their spectrum, different colors and shades.
abstract, added 09/28/2009
Preparing the monochromator for operation. Monochromator graduation. Observation of a continuous spectrum of emission and absorption spectra. Measuring the wavelength of laser radiation. Exploration of the unknown spectrum.
laboratory work, added 03/13/2007
Study of absorption spectra of electromagnetic radiation by molecules of various substances. Basic laws of light absorption. Study of molecular analysis methods: colorimetry, photocolorimetry and spectrophotomery. Colorimetric determination of nitrite.
A spectral line is emitted or absorbed as a result of a transition between two discrete energy levels. The formulas derived in the previous chapter allow us to get an idea of the spectra of the hydrogen atom and hydrogen-like ions.
14.1. Spectral series of the hydrogen atom
A spectral series is a set of transitions with a common lower level. For example, the Lyman series of the hydrogen atom and hydrogen-like ions consists of transitions to the first level: n→ 1, where the main quantum number of the upper level, or its number n, takes values 2, 3, 4, 5, etc., and the Balmer series - transitions n→ 2 for n> 2. Table 14.1.1 shows the names of the first few series of the hydrogen atom.
Table 1 4.1.1 Spectral series of the hydrogen atom
|
Title of the series |
|
|
n → 1 |
Lyman (Ly) |
|
n → 2 |
Balmera (H) |
|
n → 3 |
Pashena (P) |
|
n → 4 |
Bracket (B) |
|
n → 5 |
Pfunda (Pf) |
|
n → 6 |
Humphrey |
|
n → 7 |
Hansen–Strong |
The Lyman series of the hydrogen atom falls entirely within the vacuum ultraviolet region. In the optical range there is the Balmer series, and in the near infrared region there is the Paschen series. The first few transitions of any series are numbered with letters of the Greek alphabet according to the scheme in Table 14.1.2:
Table 14.1.2 Designations of the first lines of the spectral series
|
Dn |
||||||||
As a result of a spontaneous transition from the upper level i to the bottom j an atom emits a quantum, energy Eij which is equal to the difference
During a radiative transition from j on i a quantum with the same energy is absorbed. In the planetary model of the hydrogen atom, the energy of the levels is calculated using formula (13.5.2), and the charge of the nucleus is equal to unity:
![]() .
.
Dividing this formula by hc, we obtain the transition wave number:
The wavelength in vacuum is equal to the reciprocal of the wave number:
As the top level number increases i the transition wavelength decreases monotonically. In this case, the lines move closer together without limit. There is a lower limit to the wavelength of the series, corresponding to the ionization limit. It is usually indicated by the suffix "C" next to the series symbol. Figure 14.1.1 shows schematically

transitions, and in Fig. 14.1.2 - spectral lines of the Lyman series of the hydrogen atom.

The concentration of levels and lines near the ionization boundary is clearly visible.
Using formulas (1.3) and (1.4) with the Rydberg constant (13.6.4), we can calculate the wavelengths for any series of the hydrogen atom. Table 14.1.3 contains information about the first
Table 14.1.3. Lyman series of the hydrogen atom
|
n |
E 12 eV |
E 12 , Ry |
Wavelength, Å |
||
|
l exp. |
l theory |
||||
|
Ly a |
10. 20 |
0.75 |
1215.67 |
1215.68 |
|
|
Ly b |
12.09 |
0.89 |
1025.72 |
1025.73 |
|
|
Ly g |
12.75 |
0.94 |
972.537 |
972.548 |
|
|
Ly d |
13.05 |
0.96 |
949.743 |
949.754 |
|
|
LyC |
13.60 |
1.00 |
______ |
911.763 |
|
lines of the Lyman series. The first column shows the number of the top level number n, in the second - the transition designation. The third and fourth contain the transition energy, respectively, in electronvolts and in Rydbergs. The fifth contains the measured wavelengths of the transitions, the sixth contains their theoretical values, calculated using the planetary model. Radiation with l<2000Å сильно поглощается в земной атмосфере, поэтому длины волн серии Лаймана приведены для вакуума.
Good agreement between theory and experiment indicates the reasonableness of the provisions underlying Bohr's theory. The discrepancy in hundredths of an angstrom is due to relativistic effects, which were mentioned in the previous section. We will look at them below.
Formula (1.4) gives the wavelength in vacuum λvac. . For the optical range (λ > 2000Å), the spectroscopic tables give wavelengths λ atm. , measured in the conditions of the earth's atmosphere. Transition to λ vac. performed by multiplying by the refractive index N:
(1.5) λ vac. = N·λ atm. .
For the refractive index of air at normal humidity, the following empirical formula is valid:
(1.6) N- 1 = 28.71·10 -5 (1+5.67·10 -3 λ 2 a tm.)
Here the atmospheric wavelength is expressed in microns. We can also substitute λvac into the right-hand side of (1.6). : a slight error in wavelength has little effect on the value N – 1.
Information about the Balmer series ( j= 2) are contained in Table 14.1.4. The experimental transition wavelengths in the fifth column are given for
Table 14.1.4 Balmer series of hydrogen
|
n |
Line |
Energy of transition |
Wavelength . , Å |
|||
|
eV |
Measured in the atmosphere |
Theoretical for vacuum |
Theoretical for the atmosphere |
|||
|
H a |
1.89 |
0.14 |
6562.80 |
6564.70 |
6562.78 |
|
|
H b |
2.55 |
0.18 |
4861.32 |
4862.74 |
4861.27 |
|
|
H g |
2.86 |
0.21 |
4340.60 |
4341.73 |
4340.40 |
|
|
H d |
3.02 |
0.22 |
4101.73 |
4102.94 |
4101.66 |
|
|
3.40 |
0.25 |
______ |
3647 |
3646 |
||
normal atmospheric conditions. Theoretical wavelengths, corrected refractions using formulas (1.5) and (1.6), are given in the last column. The spectral lines of the Balmer series can be schematically depicted in

Fig.14.1.3. The position of the line is marked with a colored line; above - wavelength in angstroms, below - the accepted designation of the transition. Head line H a is in the red range of the spectrum; it usually ends up being the strongest line of the series. The remaining transitions monotonically weaken as the principal quantum number of the upper number increases. Line H b is located in the blue-green region of the spectrum, and the rest are in the blue and violet regions.
The nature of the Balmer jump
A Balmer jump is a depression of radiation in the spectra of stars at wavelengths shorter than 3700 Å. Figure 14.1.4 shows the recording patterns of the spectra of two stars. red border

photoelectric effect due to the ionization of the hydrogen atom from the second level is marked with a red dotted line ( l=3646Å), and the actual Balmer jump is blue ( l=3700Å). In the lower spectrum it is clearly depression visible near blue lines. For comparison, above is the driving star spectrum, which does not have any features in the range of 3600< l < 3700 Å.
The noticeable discrepancy between the red and blue lines in Fig. 14.1.4 does not allow us to consider the photoelectric effect as the direct cause of the phenomenon under consideration. Here, an important role is played by the superposition of lines of the Balmer series at large values n. Let us calculate the difference in wavelengths ∆λ of two adjacent transitions: i→2 and ( i+1)→2. Let us use formulas (1.3), (1.4) twice for j= 2, replacing the index i on n: For n ? 1 can be neglected compared to n, as well as four compared to ( n+1) 2:
We have obtained a quantitative expression for the above-mentioned unlimited approach of the upper members of any hydrogen series. The last formula for n> 10 has an accuracy of no worse than 5%.
Absorption lines have a certain width, depending on the physical conditions in the star’s atmosphere. As a rough approximation, it can be taken to be 1Å. We will consider two lines indistinguishable if the width of each of them is equal to the distance between the lines. Then from (1.7) it turns out that the merging of lines should occur at n≈15. Approximately this picture is observed in the spectra of real stars. So, the Balmer jump is determined by the merger of the high members of the Balmer series. We will discuss this issue in more detail in chapter seventeen.
Balmer series of deuterium
The nucleus of a heavy isotope of hydrogen - deuterium - consists of a proton and a neutron, and is approximately twice as heavy as the nucleus of a hydrogen atom - a proton. Rydberg constant for deuterium R D (13.6.5) is greater than that of hydrogen R H, so the deuterium lines are shifted to the blue side of the spectrum relative to the hydrogen lines. The wavelengths of the Balmer series of hydrogen and deuterium, expressed in angstroms, are given in Table. 14.1.5.
Table 14.1.5. Wavelengths of the Balmer series of hydrogen and deuterium.
|
deuterium |
||
|
6562.78 |
||
|
4861.27 |
||
|
4340.40 |
||
|
4101.66 |
The atomic weight of tritium is approximately three. Its lines also obey the law of the planetary model of the atom. They are blueshifted by approximately 0.6Å relative to the deuterium lines.
14.2. Transitions between highly excited states
Transitions between neighboring levels of a hydrogen atom with numbers n> 60 fall into the centimeter and longer wavelength ranges of the spectrum, which is why they are called “radio lines”. Frequencies of transitions between levels with numbers i And j are obtained from (1.3) if both sides of the formula are divided by Planck’s constant h:
The Rydberg constant, expressed in hertz, is equal to
.
A formula similar to (2.1) for states with n? 1 can be used not only in the case of hydrogen, but also for any atom. According to the material in the previous chapter, we can write
Currently, radio links have become a powerful tool for studying interstellar gas. They are obtained as a result of recombination, that is, the formation of a hydrogen atom during the collision of a proton and an electron with the simultaneous emission of excess energy in the form of a light quantum. Hence their other name follows - recombination radio lines. They are emitted by diffuse and planetary nebulae, regions of neutral hydrogen around regions of ionized hydrogen, and supernova remnants. Emission of radio lines from space objects was detected in the wavelength range from 1 mm to 21 m.
The radio link designation system is similar to the optical transitions of hydrogen. The line is indicated by three symbols. First, the name of the chemical element is written down (in this case, hydrogen), then the number of the lower level and, finally, the Greek letter with which the difference is encrypted j - i:
Designation α β γ δ
Difference j - i 1 2 3 4
For example, H109α denotes the transition from the 110th to the 109th level of hydrogen, and H137β denotes the transition between its 139th and 137th levels. Let us give the frequencies and wavelengths of three transitions of the hydrogen atom, often found in astronomical literature:
Transition H66α H109α H137β
n(MHz)223645008.95005.03
l(cm)1.3405.98535.9900
The H109α and H137β lines are always seen separately, despite the fact that they are very close in the spectrum. This is a consequence of two reasons. Firstly, using radio astronomy methods, wavelengths are measured very accurately: with six and sometimes seven correct signs (in the optical range, no more than five correct signs are usually obtained). Secondly, the lines themselves in quiet regions of the interstellar medium are much narrower than the lines in stellar atmospheres. In rarefied interstellar gas, the only mechanism for line broadening remains the Doppler effect, while in dense stellar atmospheres pressure broadening plays an important role.
The Rydberg constant increases with increasing atomic weight of a chemical element. Therefore, the He109α line is shifted toward higher frequencies than the H109α line. For a similar reason, the frequency of the C109α transition is even higher.

This is illustrated in Fig. 14.2.1, which shows a section of the spectrum of a typical gas nebula (NGC 1795). The horizontal axis shows the frequency, measured in megahertz, and the vertical axis shows the brightness temperature in degrees Kelvin. The field of the figure shows the Doppler velocity of the nebula (–42.3 km/s), which slightly changes the wavelengths of the lines compared to their laboratory values.
14.3. Isoelectronic sequence of hydrogen
According to the definition given in the fourth section of the seventh chapter, ions consisting of a nucleus and one electron are called hydrogen-like. In other words, they are said to belong to the isoelectronic sequence of hydrogen. Their structure is qualitatively reminiscent of a hydrogen atom, and the position of the energy levels of ions whose nuclear charge is not too large ( Z < 10), может быть вычислено по простой формуле (13.5.2). Однако у многозарядных ионов (Z> 20) quantitative differences appear associated with relativistic effects: the dependence of the electron mass on speed and spin-orbit interaction.
Optical transitions of the HeII ion
The charge of the helium nucleus is equal to two, therefore the wavelengths of all spectral series of the HeII ion are four times less than those of similar transitions of the hydrogen atom: for example, the wavelength of the H line a equal to 1640Å.
The Lyman and Balmer HeII series lie in the ultraviolet part of the spectrum; and the Paschen (P) and Bracket (B) series partially fall into the optical range. The most interesting transitions are collected in Table 14.3.1. As with the Balmer series of hydrogen, “atmospheric” wavelengths are given.
Table 14.3.1. Wavelengths of the Paschen and Breckett series of the HeII ion
|
Designation |
P a |
P b |
B g |
B e |
|
Wavelength, Å |
4686 |
3202 |
5411 |
4541 |
The Rydberg constant for helium is:
Let us note an important feature of the HeII ion. From 13.5.2 it follows that the level energy Zn hydrogen-like ion with nuclear charge Z, equal to the level energy n hydrogen atom. Therefore, transitions between even levels are 2 n and 2 m HeII ion and transitions n → m hydrogen atoms have very similar wavelengths. The lack of complete agreement is mainly due to the difference in values R H and R He.

In Fig. Figure 14.3.1 compares the transition schemes of the hydrogen atom (left) and the HeII ion (right). The dotted line indicates HeII transitions that practically coincide with the Balmer lines of hydrogen. Solid lines mark the transitions B γ, B ε and B η, for which there is no pair among the hydrogen lines. The top line of Table 14.3.2 shows the wavelengths of the Bracket HeII series, and the bottom line shows the lines of the Balmer series of hydrogen. Bracket series lines are also called series
Table 14.3.2. Bracket series of the HeII ion and Balmer series of the hydrogen atom
|
He II |
6560 (6 → 4) B b |
5411 (7 → 4) B g |
4859 (8 → 4) B d |
4541 (9 → 4) B ε |
4339 B ζ |
4200 Bη |
4100 Bθ |
B 13 |
|
6563 H a |
_______ |
4861 H b |
_______ |
4340 H g |
_______ |
4102 H d |
______ |
Pickering, named after the director of the Harvard Observatory, who first studied them in the spectra of hot stars in the southern sky. Note that the Pickering series was successfully explained precisely within the framework of the planetary model of the atom. Thus, she contributed to the establishment of modern views on the nature of the atom.
The reduced mass is higher for a heavier chemical element, so the level with number 2 m helium ion lies deeper than the level m hydrogen atom. Consequently, the lines of the Brackett HeII series are blueshifted relative to the corresponding transitions of the Balmer series. Relative amount of line shift Dl /l is determined in this case by the ratio of the Rydberg constants:
Absolute value Dl For l= 6560Å is approximately 3Å, in agreement with the data in Table (14.3.2).
The HeII lines corresponding to transitions between levels with even numbers overlap with the hydrogen lines, since the line widths are much greater than the distance between them. Typically, hydrogen lines are much stronger than helium lines, but there is one exception - these are Wolf-Rayet type stars. The temperature of their atmospheres exceeds 30,000K, and the helium content in terms of the number of particles is ten times greater than hydrogen. Therefore, there are a lot of helium ions there, but, on the contrary, there is little neutral hydrogen. As a result, in the spectra of Wolf–Rayet stars, all hydrogen lines are observed only as weak additions to the HeII lines. The hydrogen content in stars of this type is estimated by comparing the line depths of the Breckt HeII series with even and odd numbers of the upper level: the first are somewhat larger due to the additional contribution of hydrogen.
In the spectra of normal stars, the strongest absorption lines always remain hydrogen lines if the atmospheric temperature is above 10,000K. In Fig. 14.3.2

The log record of a hot star of spectral class O3 is shown. The lines of the Pickering series and three Balmer lines are clearly visible in the figure.
Another example of the interaction of hydrogen and HeII lines is provided by the P α transition of the HeII ion with a wavelength λ=4686Å. This line in the spectra of stars can be observed as an emission line, while the next member of the Paschen series is l 3202Å - represents a conventional absorption line. The difference in the behavior of the lines is due to the fact that the population of the upper level ( n= 4) lines l 4686 can be significantly increased by absorbing the strong Ly line a hydrogen: the wavelengths of the 2→1 transitions of the hydrogen atom and the 4→2 transitions of the HeII ion are very close. This process does not affect the radiation in the line at all. l 3202Å, in which both levels have odd numbers (transition 5→3). The interaction effect is weakened if the lower level is located high enough, for example, l 5411 and l 4541. The latter is used in the spectral classification of stars as a temperature criterion.
Multiply charged ions
The planetary model, as we have seen, is a very effective tool for studying the hydrogen atom and hydrogen-like ions. However, it remains a very rough approximation to the real structure of atoms and, in particular, multiply charged ions. Table 14.3.3 compares the experimental and theoretical wavelengths of the resonant transition Ly a for several hydrogen-like ions of interest in astronomy. The first row of the table shows
Table 14.3.3. Wavelengths of resonant transitions of hydrogen-like ions
|
l theor , Å |
||||||||||||||||
|
l exp . , Å |
303.78at i =2 and j= 1, and in the third - their experimental values. If, according to Table 14.1.3, the hydrogen atom has a discrepancy with experiment only in the sixth significant digit, then for HeII - in the fifth, for CVI and OVIII ions - in the fourth, and for FeXXVI - already in the third. These differences are due to relativistic effects, which we wrote about at the beginning of the chapter. Based on (13.7.7), we calculate the difference between the energies of the second and first levels: The factor in front of the left bracket is equal to the transition energy in the nonrelativistic approximation; it is obtained from (3.1a) at j= 1 and i = 2: Value Δ E B corresponds to the theoretical wavelength from the second row of table (14.3.3). Now we can clarify the transition wavelength. To do this, compare the relative value of the relativistic correction with relative difference  numbers from table (14.1.3). The calculation results are collected in table (14.3.4). Table 14.3.4. Comparison of the relativistic correction with experiment
A comparison of the second and third rows of the table shows that it is possible to obtain good agreement between theory and experiment, even while remaining within the framework of the semiclassical model of circular orbits. Noticeable discrepancy between dR And dl present in the iron ion. Despite its small value, it cannot be eliminated within the framework of the applied model: calculations using formula (13.7.5) do not lead to an improvement in the result. The reason lies in the fundamental drawback of the planetary model with circular electron orbits: it relates the level energy to only one quantum number. In reality, the upper level of the resonant transition is split into two sublevels. This splitting is called fine structure level. It is this that introduces uncertainty into the transition wavelength. All hydrogen-like ions have a fine structure, and the amount of splitting increases rapidly as the nuclear charge increases. To explain the fine structure we will have to abandon the simple model of circular orbits. Remaining within the framework of semiclassical concepts, let us move on to the model of elliptical orbits, which is called the Bohr–Sommerfeld model. |
Goal of the work:
1. Explore the visible part of the spectrum of the hydrogen atom.
2. Determine the Rydberg constant and ionization energy of the hydrogen atom.
Basic theoretical principles of the work.
The laws of classical physics describe continuous processes. An atom consisting of a positively charged nucleus and electrons surrounding it, according to these laws, will be in equilibrium only if the electrons continuously move around the nucleus in certain orbits. But from the point of view of classical electrodynamics, electrons moving with acceleration emit electromagnetic waves, as a result of which they lose energy and gradually fall onto the nucleus. Under these conditions, the electron's revolution frequency changes continuously and the emission spectrum of the atom must be continuous. When an electron hits the nucleus, the atom ceases to exist.
With simple calculations you can verify that the time interval after which an electron will fall onto the nucleus is 10 -11 s. Experiment shows that atomic spectra consist of individual lines or groups of lines. All this indicates that processes in which microobjects participate are characterized by discontinuity (discreteness), and the methods of classical physics, generally speaking, are not applicable to the description of intra-atomic movements.
In 1913, N. Bohr managed to construct a consistent theory that successfully explained the structure of the hydrogen atom. Bohr extended M. Planck's Postulate (1900) on the existence of stable stationary states of oscillators (which is a necessary prerequisite for deriving the correct formula for black body radiation) to any atomic systems. Bohr's theory is based on two postulates:
1. An atom and atomic systems can remain for a long time only in certain (stationary) states in which, despite the movements of charged particles occurring in them, they do not emit or absorb energy. In these states, atomic systems have energies that form a discrete series: E 1, E 2, ..., E n. These states are characterized by their stability: any change in energy as a result of absorption or emission of electromagnetic radiation or as a result of collision can only occur with a complete transition (jump) from one state to another.
2. When transitioning from one state to another, atoms emit (or absorb) radiation only at a strictly defined frequency. Radiation emitted (or absorbed) during the transition from a state with energy E m to a state E n is monochromatic, and its frequency is determined from the condition
Both postulates contradict the requirements of classical electrodynamics. The first postulate states that atoms do not emit, although the electrons that form them undergo accelerated motion (circulation in closed orbits). According to the second postulate, the emitted frequencies have nothing in common with the frequencies of the periodic motions of electrons.
The emission spectrum of a substance is an important characteristic of it, which makes it possible to establish its composition, some characteristics of its structure, and the properties of atoms and molecules.
Gas atoms emit line spectra, consisting of groups of individual spectral lines called spectral series. The simplest spectrum is that of the hydrogen atom. Already in 1885, Balmer showed that the wavelengths of the four lines lying in the visible part of the spectrum can be very accurately represented by the empirical formula
where n = 3, 4, 5, 6,…, B is an empirical constant.
The pattern expressed by this formula becomes especially clear if we present it in the form in which it is usually used at the present time:
The quantity is sometimes denoted by and called spectroscopic wave number. The constant is called Rydberg constant. Thus, we finally get
As line number n increases, the line intensity decreases. The difference between the wave numbers of neighboring lines also decreases. When n = ∞ a constant value = is obtained. If we schematically represent the location of the spectral lines defined by (4) and conventionally depict their intensity by the length of the line, we get the picture presented in Fig. 1.
A set of spectral lines that exhibit the pattern shown in Fig. 1 in their sequence and intensity distribution is called spectral series. The limiting wavelength around which the lines condense as n → ∞ is called border of the series. The series described by formula (4) is called the Balmer series.
Along with the Balmer series, a number of other series, represented by completely similar formulas, were discovered in the spectrum of the hydrogen atom.
The Lyman series was found in the ultraviolet region:
In the infrared region of the spectrum were discovered
Paschen series
Bracket Series
Pfund series
Humphrey series
Thus, all known series of atomic hydrogen can be represented by the so-called generalized Balmer formula:
where m in each series has a constant value, and n is a series of integer values starting with m+1.
The search for the physical meaning of formula (10) led to the creation of the quantum theory of the hydrogen atom. The Schrödinger equation for it is written as:
where Ψ(r) is the wave function describing the state of the electron in the atom, E is the total energy of the electron.
The solution to this equation is the spectrum of possible values of the total energy of the hydrogen atom:
According to (1), the frequency of transition between states is determined
On the other hand, according to the well-known formula
Combining (12), (13) and (14), we get:
coincides with the generalized Balmer formula.
The theoretical value of the Rydberg constant (16) still differs significantly from that experimentally obtained from spectroscopic measurements. This is due to the fact that when deriving formula (16), two assumptions are made: a) the mass of the atomic nucleus is infinitely large compared to the mass of the electron (hence the symbol “∞” in the designation of the constant) and b) the nucleus is motionless. In reality, for example, for a hydrogen atom, the mass of the nucleus is only 1836.1 times the mass of the electron. Taking this circumstance into account leads to the following formula:
where M is the mass of the atomic nucleus. In this approximation, the Rydberg constant depends on the mass of the nucleus, and therefore its value for different hydrogen-like atoms differs from each other (Fig. 2).
Fig.2 Fig.3
In order to obtain the entire set of information about an atom, it is convenient to use the energy level diagram (Fig. 3). Horizontal lines correspond to different energy states of the hydrogen atom. As the state number increases, the distance between adjacent levels decreases and in the limit becomes zero. Above the point of fusion there is a continuous region of non-quantized positive energies. The zero energy level is taken to be the energy of the level with n = ∞. Below this value the energy levels are discrete. They correspond to negative values of the total energy of the atom. This circumstance indicates that the energy of the electron in such states is less than its energy in the case when it is separated from the atom and rests at an infinitely large distance, that is, that the electron is in a bound state.
The presence of unbound electrons makes possible quantum transitions between states of the continuous energy spectrum, as well as between such states and states of the discrete energy spectrum. This appears as a continuous emission or absorption spectrum superimposed on the line spectrum of the atom. Therefore, the spectrum does not break off at the series boundary, but continues beyond it towards shorter wavelengths, where it becomes continuous. Transitions from states of a continuous spectrum (those states in which the atom is ionized) to states of a discrete spectrum are accompanied by recombination of an electron and a positive ion. The resulting radiation is called recombination.
The transition of an atom from a normal state to a higher energy level of a discrete spectrum is excitation of the atom. The transition of an atom from one of the levels of the discrete spectrum to the region of the continuous spectrum turns the atom into an unbound system. It's a process ionization of atom. The energy corresponding to the wave number of the beginning of the continuous spectrum on the side of long waves (the wave number of the series boundary) should be equal to ionization energy, that is, the energy required to separate an electron from an atom and remove it to an infinite distance. Thus, the wave number of the Lyman series boundary gives the ionization energy of the hydrogen atom in the ground, most stable state.
In this paper we study the first four lines of the Balmer series, which have the following notations:
Red line (n = 3),
Blue – blue line (n = 4),
Blue line (n = 5),
Purple line (n = 6).
Yavorsky B. What did the spectrum of the hydrogen atom tell us about // Quantum. - 1991. - No. 3. - P. 44-47.
By special agreement with the editorial board and editors of the journal "Kvant"
As is known, the radiation of isolated atoms, for example, atoms of monatomic gases or vapors of some metals, is characterized by the greatest simplicity. Such spectra are a set of discrete spectral lines of different intensities corresponding to different wavelengths. They are called line spectra.
When gases or vapors glow, the molecules of which consist of several atoms, striped spectra appear - a collection of groups of spectral lines. Finally, radiation emitted by heated liquids and solids has a continuous spectrum that contains all possible wavelengths.
In addition to emission spectra, there are also absorption spectra. Let us pass, for example, through sodium vapor light from a source producing a continuous spectrum. Then two dark lines appear in the yellow region of the continuous spectrum - the lines of the sodium absorption spectrum. The property of reversibility of spectral lines is very important: atoms absorb light containing those spectral lines that the same atoms emit. It is remarkable that the atom of each chemical element creates a line spectrum with a unique combination of spectral lines located in different places on the electromagnetic wave scale - both in its visible region and in the neighboring invisible ultraviolet and infrared regions. Just as there are no two people on Earth with the same faces, there are no two chemical elements in nature whose atoms would have the same spectra.
It turns out that line spectra are very closely related to the behavior of the so-called valence electrons of an atom. The fact is that the electrons in an atom are located around the nucleus in layers, or shells, where the electrons have different energies. In addition, different shells do not contain the same number of electrons. In the outermost energy shell, the so-called outer shell, different atoms have different numbers of electrons - from one to eight. For example, a sodium atom has only one electron in its outer shell, a carbon atom has four such “outer” electrons, and chlorine has seven. Chemists call outer electrons valence - they determine the valence of atoms, i.e. their ability to enter into chemical compounds with other atoms. Physicists call the outer electrons of atoms optical - these electrons determine all the optical properties of atoms and, first of all, their spectra.
Balyner lines in the spectrum of the hydrogen atom
The hydrogen atom is the simplest of atoms, consisting of just one proton (nucleus) and one electron. Therefore, the line spectrum of the hydrogen atom is also the simplest. It was with the study of this spectrum that theoretical spectroscopy began its journey - the study of the spectra of atoms, molecules, substances in various states of aggregation.
For the first time, lines in the spectrum of hydrogen were observed and described in detail by the German physicist I. Fraunhofer. These were the now famous Fraunhofer dark absorption lines in the solar spectrum. They occur when radiation from the Sun passes through the gases surrounding its chromosphere. Initially, Fraunhofer discovered only 4 lines, which later became known as lines H α , H β , Hγ, and H δ .
In 1885, I. Balmer, a high school physics teacher in Basel (Switzerland), carefully analyzed the photographs taken by Fraunhofer and his followers and noticed the following. If you enter some (as Balmer called it, the basic) number k, then the wavelengths of the lines H α , H β , Hγ, and Hδ can be expressed this way:
\(~\begin(matrix) \lambda_(H_(\alpha)) = \dfrac 95 k \\ \lambda_(H_(\beta)) = \dfrac 43 k \\ \lambda_(H_(\gamma)) = \dfrac(25)(21) k \\ \lambda_(H_(\delta)) = \dfrac 98 k\end(matrix)\) .
By multiplying the numerators and denominators in the fractions \(~\dfrac 43\) and \(~\dfrac 98\) by 4, Balmer obtained an amazing pattern: the numerators in the expressions for the wavelengths of all lines can be represented as a sequence of squares of numbers -
\(~3^2, 4^2, 5^2, 6^2\) ,
and the denominators are like a sequence of differences of squares -
\(~3^2 - 2^2, 4^2 - 2^2, 5^2 - 2^2, 6^2 - 2^2\) .
Thus, Balmer was able to write down one formula for the wavelengths of the four lines:
\(~\lambda = k \dfrac(n^2)(n^2 - 2^2)\) .
Where n= 3, 4, 5 and 6 respectively for lines H α , H β , Hγ, and Hδ. If λ measured in angstroms (1 A = 10 -10 m), then the number k according to Balmer it turns out to be equal to 3645 A.
Soon other lines were discovered in the absorption spectrum of hydrogen (now about 30 lines are known in the visible region of the spectrum only), and their wavelengths also “fit” into Balmer’s formula. About the accuracy with which this is obtained, judge from the table, which shows the results of observations and calculations of the wavelengths (in angstroms) of the first seven lines, for which the number n varies from 3 to 9:
These figures show that in spectroscopy calculations are carried out with extraordinary accuracy. Before the advent of spectroscopic calculations, it was believed that calculations in astronomy had the greatest accuracy. However, it turned out that the accuracy of calculations in spectroscopy is not only not inferior, but in a number of cases w exceeds astronomical accuracy.
Balmer hoped that the spectra of other atoms, more complex than hydrogen, could also be described by formulas similar to the formula he discovered. In his opinion, finding the “master number” for atoms of other elements will be a very difficult task. Fortunately for all atomic physics, and especially for spectroscopy, Balmer was wrong. Magnitude k entered into the spectral formulas for the radiation of atoms of all chemical elements 1[however, the formulas themselves differ from the Balmer formula by a number of correction terms].
Rydberg constant. Full spectrum of hydrogen atom
In 1890, the Swedish spectroscopist physicist Rydberg wrote down Balmer's formula in an “inverted” form” for the quantity \(~N = \dfrac(1)(\lambda)\). It is called the wave number and shows how many wavelengths in a vacuum fit onto a unit length. Wave number is easily related to the frequency of light ν :
\(~\nu = \dfrac(c)(\lambda) = cN\) ,
Where c- speed of light. Spectroscopy always deals with wave numbers rather than frequencies. This is due to the fact that wavelengths, and therefore wave numbers, can be determined experimentally with much greater accuracy than frequencies. (Note that sometimes the wave number is denoted by the same letter ν , the same as the oscillation frequency. True, it is usually clear from the context what exactly is being said, but sometimes this introduces unnecessary confusion.)
“Inverting” Balmer’s formula, we obtain for the wave number
\(~N = \dfrac(1)(\lambda) = \dfrac(1)(k) \dfrac(n^2 - 4)(n^2) = \dfrac(4)(k) \left(\ dfrac(1)(2^2) - \dfrac(1)(n^2) \right)\) .
Let us denote the constant value \(~\dfrac(4)(k)\) by R(the first letter of Rydberg's surname). Then finally Balmer’s formula can be written in the form in which it is usually used:
\(~N = R \left(\dfrac(1)(2^2) - \dfrac(1)(n^2) \right)\) , where n = 3, 4, 5, 6 ,…
Balmer's formula shows that as the number increases n the wave numbers of “neighboring” spectral lines have increasingly similar values (the difference between them decreases) - the spectral lines come closer together. All spectral lines, the wave numbers of which are calculated using the Balmer formula, form the Balmer spectral series. The largest number of spectral lines of the Balmer series (37 lines) was found in the spectrum of the solar chromosphere and prominences (clouds of hot gases formed on the Sun and ejected from it). The Rydberg constant was measured with great accuracy on the lines of the Balmer series. She turned out to be equal R= 109677.581 cm -1.
The surprising agreement between the results of measurements of the wavelengths of the lines of the hydrogen spectrum in the visible region of the spectrum and calculations using the Balmer formula prompted researchers to study the spectrum of hydrogen in other areas. These searches were crowned with success. In addition to the Balmer series, other series were discovered in the spectrum of the hydrogen atom, and all of them were described by spectral formulas similar to the Balmer formula.
Thus, in the far ultraviolet part of the spectrum - in the wavelength region of ~1200 A and less - Lyman discovered a series of lines, now called the Lyman series:
\(~N = R \left(\dfrac(1)(1^2) - \dfrac(1)(n^2) \right)\) , where n = 2, 3, 4, …
In the infrared part of the spectrum, three series of spectral lines were discovered: in the wavelength range from 10,000 to 20,000 A - the Paschen series, described by the formula
\(~N = R \left(\dfrac(1)(3^2) - \dfrac(1)(n^2) \right)\) , where n = 4, 5, 6, …
in the wavelength region close to 40,000 A - Brackett series
\(~N = R \left(\dfrac(1)(4^2) - \dfrac(1)(n^2) \right)\) , where n = 5, 6, …
finally, in the very far infrared region, near 75,000 A - Pfund series
\(~N = R \left(\dfrac(1)(5^2) - \dfrac(1)(n^2) \right)\) , where n = 6, 7, …
Thus, all spectral lines detected at the hydrogen atom in different parts of the spectrum can be covered by one general formula - the Balmer-Rydberg formula
\(~N = R \left(\dfrac(1)(m^2) - \dfrac(1)(n^2) \right)\) .
In this formula, for each series of lines the number m has a constant value from 1 to 5: m=1, 2, 3, 4, 5, and within this series the number n takes on a series of increasing numerical values, starting from m + 1.
Atomic emission spectrum of hydrogen is a collection of lines among which three groups of lines, or series, can be distinguished (Fig. 1.13).
Rice. 1.13. Atomic emission spectrum of hydrogen.
A series of lines in the ultraviolet region of the spectrum is called the Lyman series. Its lines obey the equation
Bohr connected the values of numbers in these equations with “quantum numbers” (ordinal numbers) of the energy levels of the electron in the hydrogen atom (Fig. 1.14). When this electron is in its ground state, its quantum number u = 1. Each line of the Lyman series corresponds to the return of an excited electron from one of the higher energy levels to the ground state. The Balmer series corresponds to the return of electrons from various high energy levels to the first excited state (to a level with quantum number u = 2). The Paschen series corresponds to the return of electrons to a level with quantum number u = 3 (to the second excited state).
Let us pay attention to the fact that the lines of each series gradually approach a certain limit as the wavelength decreases (see Fig. 1.13 and 1.14). The wavelength of this convergence limit for each series is determined by the corresponding dotted line in the figures. As the quantum number increases, the energy levels of the electron in the hydrogen atom become increasingly denser, approaching a certain limit. The convergence limits of the spectral series correspond to transitions of electrons located at these highest energy levels.

But what happens if the electron gains even more energy? In this case, the electron will be able to separate from the atom. As a result, the atom will become ionized, turning into a positively charged ion. The energy required to excite an electron so that it can be separated from an atom is called ionization energy. The values of ionization energies of atoms provide important information about their electronic structure.