Graphs of inequalities with two variables. Equations and inequalities with two variables
Let f(x,y) And g(x, y)- two expressions with variables X And at and scope X. Then inequalities of the form f(x, y) > g(x, y) or f(x, y) < g(x, y) called inequality with two variables .
Meaning of Variables x, y from many X, at which the inequality turns into a true numerical inequality, it is called decision and is designated (x, y). Solve inequality - this means finding many such pairs.
If each pair of numbers (x, y) from the set of solutions to the inequality, match the point M(x, y), we obtain the set of points on the plane specified by this inequality. He is called graph of this inequality . The graph of an inequality is usually an area on a plane.
To depict the set of solutions to the inequality f(x, y) > g(x, y), proceed as follows. First, replace the inequality sign with an equal sign and find a line that has the equation f(x,y) = g(x,y). This line divides the plane into several parts. After this, it is enough to take one point in each part and check whether the inequality is satisfied at this point f(x, y) > g(x, y). If it is executed at this point, then it will be executed in the entire part where this point lies. Combining such parts, we obtain many solutions.
Task. y > x.
Solution. First, we replace the inequality sign with an equal sign and construct a line in a rectangular coordinate system that has the equation y = x.
This line divides the plane into two parts. After this, take one point in each part and check whether the inequality is satisfied at this point y > x.
Task. Solve graphically the inequality
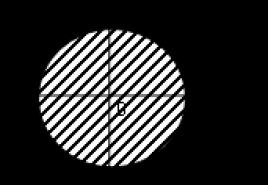
X 2 + at 2 £25.
|

Let two inequalities be given f 1(x, y) > g 1(x, y) And f 2(x, y) > g 2(x, y).
Systems of sets of inequalities with two variables
System of inequalities is yourself conjunction of these inequalities. System solution is every meaning (x, y), which turns each of the inequalities into a true numerical inequality. Many solutions systems inequalities is the intersection of sets of solutions to inequalities that form a given system.
Set of inequalities is yourself disjunction of these inequalities Set solution is every meaning (x, y), which converts at least one of the set of inequalities into a true numerical inequality. Many solutions totality is a union of sets of solutions to inequalities that form a set.
Task. Solve graphically the system of inequalities 
 Solution. y = x And X 2 + at 2 = 25. We solve each inequality of the system.
The graph of the system will be the set of points on the plane that are the intersection (double hatching) of the sets of solutions to the first and second inequalities.
Task. Solve graphically a set of inequalities 

Exercises for independent work
1. Solve graphically the inequalities: a) at> 2x; b) at< 2x + 3;
V) x 2+ y 2 > 9; G) x 2+ y 2 £4.
2. Solve graphically systems of inequalities:
a) b) 
Systems of inequalities
with two variables
To the textbook by Yu.N. Makarychev
Algebra, 9th grade, Chapter III §
mathematics teacher of the highest category
Municipal educational institution "Upshinskaya basic secondary school"
Orsha district of the Republic of Mari El

Solving the system of inequalities
with two variables
A solution to a system of inequalities with two variables is a pair of values of these variables that is both a solution to the first inequality and the second inequality of the system.
(1; 2) – solution?
(2; 1) – solution?
(1; 2) – solution
(2; 1) is not a solution

Representation of the set of solutions to an inequality in two variables on the coordinate plane
A parabola divides the coordinate plane into two regions. The solution to the inequality is the region with point A.

Representation of the set of solutions to a system of inequalities with two variables on the coordinate plane
The set of solutions to a system of inequalities with two variables is the intersection of the sets of solutions to inequalities included in the system. On the coordinate plane, the set of solutions to a system of inequalities is depicted by a set of points that are a common part of the sets that represent solutions to each inequality of the system.

X = 2
- Let's build a straight line X = 2.
- Let's build a straight line at = -3.
- It divides the plane into two areas, select the area we need and apply shading
at = -3
The solutions of this system are the coordinates of the intersection points of the sets of solutions to the inequalities of the system (right angle)

- Let's build a straight line 2y + 3x = 6
- It divides the plane into two areas, select the area we need and apply shading
- Let's build a straight line at- 2x = -3
- It divides the plane into two areas, select the area we need and apply shading
The solutions of a given system are the coordinates of the intersection points of the sets of solutions to the system’s inequalities (angle)

- Let's construct a straight line y = 2 x + 1
- It divides the plane into two areas, select the area we need and apply shading
- Let's construct a straight line y = 2 x - 1
- It divides the plane into two areas, select the area we need and apply shading
The solutions of a given system are the coordinates of the intersection points of the sets of solutions to the inequalities of the system (strip)

- Let's build a circle X 2 + y 2 = 1
- It divides the plane into two areas, select the area we need and apply shading
- Let's construct a straight line 2x + y = 0
- It divides the plane into two areas, select the area we need and apply shading
The solutions of this system are the points of the semicircle

- Let's construct a parabola y = (x - 1) 2 -2
- It divides the plane into two areas, select the area we need and apply shading
- Let's construct a circle (x-1) 2 + (y+2) 2 =1
- It divides the plane into two areas, select the area we need and apply shading
The solutions of a given system are the intersection points of the sets of solutions to the inequalities of the system

Draw a set of points that are solutions to the system and calculate the area of the resulting figure

, and even more so systems of inequalities with two variables, it seems quite a difficult task. However, there is a simple algorithm that helps solve seemingly very complex problems of this kind easily and without much effort. Let's try to figure it out.
Let us have an inequality with two variables of one of the following types:
y > f(x); y ≥ f(x); y< f(x); y ≤ f(x).
To depict the set of solutions to such an inequality on the coordinate plane, proceed as follows:
- We build a graph of the function y = f(x), which divides the plane into two regions.
- We select any of the resulting areas and consider an arbitrary point in it. We check the feasibility of the original inequality for this point. If the test results in a correct numerical inequality, then we conclude that the original inequality is satisfied in the entire region to which the selected point belongs. Thus, the set of solutions to the inequality is the region to which the selected point belongs. If the check results in an incorrect numerical inequality, then the set of solutions to the inequality will be the second region to which the selected point does not belong.
- If the inequality is strict, then the boundaries of the region, that is, the points of the graph of the function y = f(x), are not included in the set of solutions and the boundary is depicted with a dotted line. If the inequality is not strict, then the boundaries of the region, that is, the points of the graph of the function y = f(x), are included in the set of solutions to this inequality and the boundary in this case is depicted as a solid line. Now let's look at several problems on this topic.
Task 1.
What set of points is given by the inequality x · y ≤ 4?
Solution.
1) We build a graph of the equation x · y = 4. To do this, we first transform it. Obviously, x in this case does not turn to 0, since otherwise we would have 0 · y = 4, which is incorrect. This means we can divide our equation by x. We get: y = 4/x. The graph of this function is a hyperbola. It divides the entire plane into two regions: the one between the two branches of the hyperbola and the one outside them.
2) Let’s select an arbitrary point from the first region, let it be point (4; 2). Let's check the inequality: 4 · 2 ≤ 4 – false.
This means that the points of this region do not satisfy the original inequality. Then we can conclude that the set of solutions to the inequality will be the second region to which the selected point does not belong.
3) Since the inequality is not strict, we draw the boundary points, that is, the points of the graph of the function y=4/x, with a solid line.
Let us paint the set of points that defines the original inequality in yellow (Fig. 1).
Task 2.
Draw the area defined on the coordinate plane by the system
Solution.
To begin with, we build graphs of the following functions (Fig. 2):
y = x 2 + 2 – parabola,
y + x = 1 – straight line
x 2 + y 2 = 9 – circle.

Now let's look at each inequality separately.
1) y > x 2 + 2.
We take the point (0; 5), which lies above the graph of the function. Let's check the inequality: 5 > 0 2 + 2 – true.
Consequently, all points lying above the given parabola y = x 2 + 2 satisfy the first inequality of the system. Let's paint them yellow.
2) y + x > 1.
We take the point (0; 3), which lies above the graph of the function. Let's check the inequality: 3 + 0 > 1 – true.
Consequently, all points lying above the straight line y + x = 1 satisfy the second inequality of the system. Let's paint them with green shading.
3) x 2 + y 2 ≤ 9.
We take the point (0; -4), which lies outside the circle x 2 + y 2 = 9. We check the inequality: 0 2 + (-4) 2 ≤ 9 – incorrect.
Consequently, all points lying outside the circle x 2 + y 2 = 9 do not satisfy the third inequality of the system. Then we can conclude that all points lying inside the circle x 2 + y 2 = 9 satisfy the third inequality of the system. Let's paint them with purple shading.

Do not forget that if the inequality is strict, then the corresponding boundary line should be drawn with a dotted line. We get the following picture (Fig. 3).

The search area is the area where all three colored areas intersect with each other (Fig. 4).
Questions for notes

Write an inequality whose solution is a circle and points inside the circle: 
Find the points that solve the inequality:
1) (6;10)
2) (-12;0)
3) (8;9)
4) (9;7)
5) (-12;12)
https://accounts.google.com
Slide captions:
Inequalities with two variables and their systems Lesson 1
Inequalities with two variables Inequalities 3x – 4y 0; and are inequalities with two variables x and y. The solution to an inequality in two variables is a pair of values of the variables that turns it into a true numerical inequality. For x = 5 and y = 3, the inequality 3x - 4y 0 turns into the correct numerical inequality 3 0. The pair of numbers (5;3) is a solution to this inequality. The pair of numbers (3;5) is not its solution.
Is the pair of numbers (-2; 3) a solution to the inequality: No. 482 (b, c) Is not Is
The solution to an inequality is an ordered pair of real numbers that turns the inequality into a true numerical inequality. Graphically, this corresponds to specifying a point on the coordinate plane. Solving an inequality means finding many solutions to it.
Inequalities with two variables have the form: The set of solutions to an inequality is the set of all points of the coordinate plane that satisfy a given inequality.
Solution sets for the inequality F(x,y) ≥ 0 x y F(x,y)≤0 x y
F(x, y)>0 F(x, y)
Trial point rule Construct F(x ; y)=0 Taking a trial point from any area, determine whether its coordinates are a solution to the inequality Draw a conclusion about the solution to the inequality x y 1 1 2 A(1;2) F(x ; y) =0
Linear inequalities with two variables A linear inequality with two variables is called an inequality of the form ax + bx +c 0 or ax + bx +c
Find the error! No. 484 (b) -4 2 x 2 -6 y 6 -2 0 4 -2 - 4
Solve graphically the inequality: -1 -1 0 x 1 -2 y -2 2 2 1 We draw graphs with solid lines:
Let's determine the inequality sign in each of the areas -1 -1 0 x 1 -2 y -2 2 2 1 3 4 - + 1 + 2 - 7 + 6 - 5 +
The solution to the inequality is a set of points from the areas containing the plus sign and solutions to the equation -1 -1 0 x 1 -2 y -2 2 2 1 3 4 - + 1 + 2 - 7 + 6 - 5 +
Let's solve together No. 485 (b) No. 486 (b, d) No. 1. Set the inequality and draw on the coordinate plane the set of points for which: a) the abscissa is greater than the ordinate; b) the sum of the abscissa and ordinate is greater than their double difference.
Let's solve together No. 2. Define by inequality an open half-plane located above the straight line AB passing through points A(1;4) and B(3;5). Answer: y 0.5x +3.5 No. 3. For what values of b does the set of solutions to the inequality 3x – b y + 7 0 represent an open half-plane located above the straight line 3x – b y + 7 = 0. Answer: b 0.
Homework P. 21, No. 483; No. 484(c,d); No. 485(a); No. 486(c).
Preview:
To use presentation previews, create a Google account and log in to it: https://accounts.google.com
Slide captions:
Inequalities with two variables and their systems Lesson 2
Systems of inequalities with two variables
The solution to a system of inequalities with two variables is a pair of values of variables that turns each of the inequalities of the system into a true numerical inequality. No. 1. Draw the set of solutions to systems of inequalities. No. 496 (oral)
a) x y 2 2 x y 2 2 b)
Let’s solve together No. 1. At what values of k does the system of inequalities define a triangle on the coordinate plane? Answer: 0
We solve together x y 2 2 2 2 No. 2. The figure shows a triangle with vertices A(0;5), B(4;0), C(1;-2), D(-4;2). Define this quadrilateral with a system of inequalities. A B C D
Let's solve together No. 3. For what k and b is the set of points of the coordinate plane defined by the system of inequalities: a) strip; b) angle; c) an empty set. Answer: a) k= 2,b 3; b) k ≠ 2, b – any number; c) k = 2; b
Let's solve number 4 together. What figure is given by the equation? (orally) 1) 2) 3) No. 5. Draw on the coordinate plane the set of solutions of points specified by the inequality.
Let's solve together No. 497 (c, d), 498 (c)
Homework P.22 No. 496, No. 497 (a, b), No. 498 (a, b), No. 504.
Preview:
To use presentation previews, create a Google account and log in to it: https://accounts.google.com
Slide captions:
Inequalities with two variables and their systems Lesson 3
Find the error! -4 2 x 2 -6 y 6 -2 0 4 -2 - 4
Find the error! | | | | | | | | | | | | | | | | | | 1 x y 2
Determine the inequality 0 - 6 - 1 5 3 1 2 y x - 3 - 2 1 -3 4
0 - 6 - 1 5 3 1 2 y x - 3 - 2 1 -3 4 Determine the inequality
0 - 3 - 1 5 3 1 2 y x - 3 - 2 1 Determine the inequality sign ≤
Solve graphically the system of inequalities -1 -1 0 x 1 -2 y -2 2 2 1
Inequalities and systems of inequalities of higher degrees with two variables No. 1. Draw on the coordinate plane the set of points specified by the system of inequalities
Inequalities and systems of inequalities of higher degrees with two variables No. 2. Draw on the coordinate plane the set of points specified by the system of inequalities
Inequalities and systems of inequalities of higher degrees with two variables No. 3. Draw on the coordinate plane the set of points specified by the system of inequalities. Let us transform the first inequality of the system:
Inequalities and systems of inequalities of higher degrees with two variables We obtain an equivalent system
Inequalities and systems of inequalities of higher degrees with two variables No. 4. Draw on the coordinate plane the set of points specified by the system of inequalities
Let's decide together No. 502 Collection of Galitsky. No. 9.66 b) y ≤ |3x -2| 0 - 6 - 1 5 3 1 2 y x - 3 - 2 1 -3 4
. No. 9.66(c) Solve together 0 - 6 - 1 5 3 1 2 y x - 3 - 2 1 -3 4 |y| ≥ 3x - 2
We solve together No. 9.66(g) 0 - 6 - 1 5 3 1 2 y x - 3 - 2 1 -3 4 |y|
Solve the inequality: x y -1 -1 0 1 -2 -2 2 2 1
0 - 6 - 1 5 3 1 2 y x - 3 - 2 1 -3 4 Write down the system of inequalities
11:11 3) What figure is determined by the set of solutions to the system of inequalities? Find the area of each figure. 6) How many pairs of natural numbers are solutions to the system of inequalities? Calculate the sum of all such numbers. Solution of training exercises 2) Write down a system of inequalities with two variables, the set of solutions of which is shown in Figure 0 2 x y 2 1) Draw the set of solutions of the system on the coordinate plane: 4) Define the ring shown in the figure as a system of inequalities. 5) Solve the system of inequalities y x 0 5 10 5 10
Solution of training exercises 7) Calculate the area of the figure given by the set of solutions to the system of inequalities and find the greatest distance between the points of this figure 8) At what value of m does the system of inequalities have only one solution? 9) Indicate some values of k and b at which the system of inequalities defines on the coordinate plane: a) a strip; b) angle.
This is interesting. The English mathematician Thomas Harriot (Harriot T., 1560-1621) introduced the familiar inequality sign, arguing it as follows: “If two parallel segments serve as a symbol of equality, then intersecting segments must be a symbol of inequality.” In 1585, young Harriot was sent by the Queen of England on an exploring expedition to North America. There he saw a tattoo popular among Indians in the form. This is probably why Harriot proposed the inequality sign in two of its forms: “>” is greater than... and “
This is interesting. The symbols ≤ and ≥ for non-strict comparison were proposed by Wallis in 1670. Originally, the line was above the comparison sign, and not below it, as it is now. These symbols became widespread after the support of the French mathematician Pierre Bouguer (1734), from whom they acquired their modern form.