Graph of the function y sin 1. Graph of the function y=sin x
The video lesson “Function y = sinx, ee properties and graph” presents visual material on this topic, as well as comments on it. During the demonstration, the type of function, its properties are considered, the behavior on various segments of the coordinate plane, features of the graph are described in detail, and an example of a graphical solution of trigonometric equations containing a sine is described. With the help of a video lesson, it is easier for a teacher to formulate a student’s understanding of this function and teach them to solve problems graphically.
The video lesson uses tools to make it easier to memorize and understand educational information. In the presentation of graphs and in describing the solution of problems, animation effects are used that help to understand the behavior of the function and present the progress of the solution sequentially. Also, voicing the material supplements it with important comments that replace the teacher’s explanation. Thus, this material can also be used as a visual aid. And as an independent part of the lesson instead of the teacher’s explanation on a new topic.
The demonstration begins by introducing the topic of the lesson. The sine function is presented, the description of which is highlighted in a box for memorization - s=sint, in which the argument t can be any real number. The description of the properties of this function begins with the domain of definition. It is noted that the domain of definition of the function is the entire numerical axis of real numbers, that is, D(f)=(- ∞;+∞). The second property is the oddness of the sine function. Students are reminded that this property was studied in 9th grade, when it was noted that for an odd function the equality f(-x)=-f(x) holds. For the sine, confirmation of the oddness of the function is demonstrated on the unit circle, divided into quarters. Knowing what sign the function takes in different quarters of the coordinate plane, it is noted that for arguments with opposite signs, using the example of points L(t) and N(-t), the oddity condition is satisfied for the sine. Therefore s=sint is an odd function. This means that the graph of the function is symmetrical about the origin.
The third property of the sine demonstrates the intervals between increasing and decreasing functions. It notes that this function increases on the segment, and decreases on the segment [π/2;π]. The property is demonstrated in the figure, which shows a unit circle and when moving from point A counterclockwise, the ordinate increases, that is, the value of the function increases to π/2. When moving from point B to C, that is, when the angle changes from π/2 to π, the ordinate value decreases. In the third quarter of the circle, when moving from point C to point D, the ordinate decreases from 0 to -1, that is, the value of the sine decreases. In the last quarter, when moving from point D to point A, the ordinate value increases from -1 to 0. Thus, we can draw a general conclusion about the behavior of the function. The screen displays the output that sint increases on the segment [-(π/2)+2πk; (π/2)+2πk], decreases on the interval [(π/2)+2πk; (3π/2)+2πk] for any integer k.
The fourth property of sine considers the boundedness of the function. It is noted that the sint function is bounded both above and below. Students are reminded of information from 9th grade algebra when they were introduced to the concept of boundedness of a function. The condition of a function bounded from above is displayed on the screen, for which there is a certain number for which the inequality f(x)>=M holds at any point of the function. We also recall the condition of a function bounded below, for which there is a number m less than each point of the function. For sint the condition -1 is satisfied<= sint<=1. То есть данная функция ограничена сверху и снизу. То есть она является ограниченной.
The fifth property considers the smallest and largest values of the function. The achievement of the smallest value -1 at each point t=-(π/2)+2πk, and the largest at points t=(π/2)+2πk is noted.
Based on the properties considered, a graph of the sint function is constructed on the segment. To construct the function, the tabular values of the sine at the corresponding points are used. The coordinates of points π/6, π/3, π/2, 2π/3, 5π/6, π are marked on the coordinate plane. By marking the table values of the function at these points and connecting them with a smooth line, we build a graph.
To plot a graph of the function sint on the segment [-π;π], the property of symmetry of the function with respect to the origin of coordinates is used. The figure shows how the line obtained as a result of construction is smoothly transferred symmetrically relative to the origin of coordinates to the segment [-π;0].
Using the property of the sint function, expressed in the reduction formula sin(x+2π) = sin x, it is noted that every 2π the sine graph repeats. Thus, on the interval [π; 3π] the graph will be the same as on [-π;π]. Thus, the graph of this function represents repeating fragments [-π;π] throughout the entire domain of definition. It is separately noted that such a graph of a function is called a sinusoid. The concept of a sine wave is also introduced - a fragment of a graph built on the segment [-π;π], and a sinusoid arc built on the segment . These fragments are shown again for memorization.
It is noted that the sint function is a continuous function over the entire domain of definition, and also that the range of values of the function lies in the set of values of the segment [-1;1].
At the end of the video lesson, a graphical solution to the equation sin x=x+π is considered. Obviously, the graphical solution to the equation will be the intersection of the graph of the function given by the expression on the left side and the function given by the expression on the right side. To solve the problem, a coordinate plane is constructed, on which the corresponding sinusoid y=sin x is outlined, and a straight line corresponding to the graph of the function y=x+π is constructed. The constructed graphs intersect at a single point B(-π;0). Therefore x=-π will be the solution to the equation.

The video lesson “Function y = sinx, ee properties and graph” will help increase the effectiveness of a traditional mathematics lesson at school. You can also use visual material when performing distance learning. The manual can help master the topic for students who require additional lessons for a deeper understanding of the material.
TEXT DECODING:
The topic of our lesson is “The function y = sin x, its properties and graph.”
Previously, we have already become acquainted with the function s = sin t, where tϵR (es is equal to sine te, where te belongs to the set of real numbers). Let's study the properties of this function:
PROPERTIES 1. The domain of definition is the set of real numbers R (er), that is, D(f) = (- ; +) (de from ef represents the interval from minus infinity to plus infinity).
PROPERTY 2. The function s = sin t is odd.
In the 9th grade lessons we learned that the function y = f (x), x ϵX (the y is equal to ef of x, where x belongs to the set x is large) is called odd if for any value x from the set X the equality
f (- x) = - f (x) (eff from minus x is equal to minus ef from x).
And since the ordinates of points L and N that are symmetrical about the abscissa axis are opposite, then sin(- t) = -sint.
That is, s = sin t is an odd function and the graph of the function s = sin t is symmetrical with respect to the origin in the rectangular coordinate system tOs(te o es).
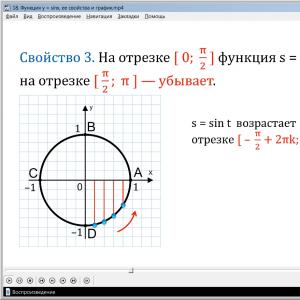
Let's consider PROPERTY 3. On the interval [ 0; ] (from zero to pi by two) the function s = sin t increases and decreases on the segment [; ](from pi by two to pi).
This is clearly visible in the figures: when a point moves along the number circle from zero to pi by two (from point A to B), the ordinate gradually increases from 0 to 1, and when moving from pi by two to pi (from point B to C), the ordinate gradually decreases from 1 to 0.

When a point moves along the third quarter (from point C to point D), the ordinate of the moving point decreases from zero to minus one, and when moving along the fourth quarter, the ordinate increases from minus one to zero. Therefore, we can draw a general conclusion: the function s = sin t increases on the interval
(from minus pi by two plus two pi ka to pi by two plus two pi ka), and decreases on the segment [; (from pi by two plus two pi ka to three pi by two plus two pi ka), where
(ka belongs to the set of integers).
PROPERTY 4. The function s = sint is bounded above and below.
From the 9th grade course, recall the definition of boundedness: a function y = f (x) is called bounded from below if all values of the function are not less than a certain number m m such that for any value x from the domain of definition of the function the inequality f (x) ≥ m(ef from x is greater than or equal to em). A function y = f (x) is said to be bounded above if all values of the function are not greater than a certain number M, this means that there is a number M such that for any value x from the domain of definition of the function the inequality f (x) ≤ M(eff from x is less than or equal to em). A function is called bounded if it is bounded both below and above.
Let's return to our function: boundedness follows from the fact that for any te the inequality is true - 1 ≤ sint≤ 1. (the sine of te is greater than or equal to minus one, but less than or equal to one).
PROPERTY 5. The smallest value of a function is equal to minus one and the function reaches this value at any point of the form t = (te is equal to minus pi by two plus two peaks, and the largest value of the function is equal to one and is achieved by the function at any point of the form t = (te is equal pi times two plus two pi ka).
The largest and smallest values of the function s = sin t denote s most. and s max. .
Using the obtained properties, we will construct a graph of the function y = sin x (the y is equal to sine x), because we are more accustomed to writing y = f (x) rather than s = f (t).
To begin with, let’s choose a scale: along the ordinate axis, let’s take two cells as a unit segment, and along the abscissa axis, two cells are pi by three (since ≈ 1). First, let's build a graph of the function y = sin x on the segment. We need a table of function values on this segment; to construct it, we will use the table of values for the corresponding cosine and sine angles:
Thus, to build a table of argument and function values, you must remember that X(x) this number is correspondingly equal to the angle in the interval from zero to pi, and at(Greek) the value of the sine of this angle.
Let's mark these points on the coordinate plane. According to PROPERTY 3 on the segment
[ 0; ] (from zero to pi by two) the function y = sin x increases and decreases on the segment [; ](from pi by two to pi) and connecting the resulting points with a smooth line, we get part of the graph. (Fig. 1)
Using the symmetry of the graph of an odd function relative to the origin, we obtain a graph of the function y = sin x already on the segment
[-π; π ] (from minus pi to pi). (Fig. 2)
Recall that sin(x + 2π)= sinx
(the sine of x plus two pi is equal to the sine of x). This means that at point x + 2π the function y = sin x takes on the same value as at point x. And since (x + 2π)ϵ [π; 3π ](x plus two pi belongs to the segment from pi to three pi), if xϵ[-π; π ], then on the segment [π; 3π ] the graph of the function looks exactly the same as on the segment [-π; π]. Similarly, on the segments , , [-3π; -π ] and so on, the graph of the function y = sin x looks the same as on the segment
[-π; π].(Fig.3)

The line that is the graph of the function y = sin x is called a sine wave. The portion of the sine wave shown in Figure 2 is called a sine wave, while in Figure 1 it is called a sine wave or half wave.
Using the constructed graph, we write down a few more properties of this function.
PROPERTY 6. The function y = sin x is a continuous function. This means that the graph of the function is continuous, that is, it has no jumps or punctures.
PROPERTY 7. The range of values of the function y = sin x is the segment [-1; 1] (from minus one to one) or it can be written like this: (e from ef is equal to the segment from minus one to one).
Let's look at an EXAMPLE. Solve graphically the equation sin x = x + π (sine x equals x plus pi).
Solution. Let's build function graphs y = sin X And y = x + π.
The graph of the function y = sin x is a sinusoid.
y = x + π is a linear function, the graph of which is a straight line passing through the points with coordinates (0; π) and (- π ; 0).
The constructed graphs have one intersection point - point B(- π;0) (be with coordinates minus pi, zero). This means that this equation has only one root - the abscissa of point B - -π. Answer: X = - π.
We found out that the behavior of trigonometric functions, and the functions y = sin x in particular, on the entire number line (or for all values of the argument X) is completely determined by its behavior in the interval 0 < X < π / 2 .
Therefore, first of all, we will plot the function y = sin x exactly in this interval.
Let's make the following table of values of our function;
By marking the corresponding points on the coordinate plane and connecting them with a smooth line, we obtain the curve shown in the figure

The resulting curve could also be constructed geometrically, without compiling a table of function values y = sin x .

1. Divide the first quarter of a circle of radius 1 into 8 equal parts. The ordinates of the dividing points of the circle are the sines of the corresponding angles.
2.The first quarter of the circle corresponds to angles from 0 to π / 2 . Therefore, on the axis X Let's take a segment and divide it into 8 equal parts.
3. Let's draw straight lines parallel to the axes X, and from the division points we construct perpendiculars until they intersect with horizontal lines.
4. Connect the intersection points with a smooth line.
Now let's look at the interval π /
2
<
X <
π
.
Each argument value X from this interval can be represented as
x = π / 2 + φ
Where 0 < φ < π / 2 . According to reduction formulas
sin( π / 2 + φ ) = cos φ = sin ( π / 2 - φ ).
Axis points X with abscissas π / 2 + φ And π / 2 - φ symmetrical to each other about the axis point X with abscissa π / 2 , and the sines at these points are the same. This allows us to obtain a graph of the function y = sin x in the interval [ π / 2 , π ] by simply symmetrically displaying the graph of this function in the interval relative to the straight line X = π / 2 .

Now using the property odd parity function y = sin x,
sin(- X) = - sin X,
it is easy to plot this function in the interval [- π , 0].

The function y = sin x is periodic with a period of 2π ;. Therefore, to construct the entire graph of this function, it is enough to continue the curve shown in the figure to the left and right periodically with a period 2π .

The resulting curve is called sinusoid . It represents the graph of the function y = sin x.

The figure illustrates well all the properties of the function y = sin x , which we have previously proven. Let us recall these properties.
1) Function y = sin x defined for all values X , so its domain is the set of all real numbers.
2) Function y = sin x limited. All the values it accepts are between -1 and 1, including these two numbers. Consequently, the range of variation of this function is determined by the inequality -1 < at < 1. When X = π / 2 + 2k π the function takes the largest values equal to 1, and for x = - π / 2 + 2k π - the smallest values equal to - 1.
3) Function y = sin x is odd (the sinusoid is symmetrical about the origin).
4) Function y = sin x periodic with period 2 π .
5) In 2n intervals π < x < π + 2n π (n is any integer) it is positive, and in intervals π + 2k π < X < 2π + 2k π (k is any integer) it is negative. At x = k π the function goes to zero. Therefore, these values of the argument x (0; ± π ; ±2 π ; ...) are called function zeros y = sin x
6) At intervals - π / 2 + 2n π < X < π / 2 + 2n π function y = sin x increases monotonically, and in intervals π / 2 + 2k π < X < 3π / 2 + 2k π it decreases monotonically.
You should pay special attention to the behavior of the function y = sin x near the point X = 0 .
For example, sin 0.012 ≈ 0.012; sin(-0.05) ≈ -0,05;
sin 2° = sin π 2 / 180 = sin π / 90 ≈ 0,03 ≈ 0,03.
At the same time, it should be noted that for any values of x
| sin x| < | x | . (1)
Indeed, let the radius of the circle shown in the figure be equal to 1,
a /
AOB = X.

Then sin x= AC. But AC< АВ, а АВ, в свою очередь, меньше длины дуги АВ, на которую опирается угол X. The length of this arc is obviously equal to X, since the radius of the circle is 1. So, at 0< X < π / 2
sin x< х.
Hence, due to the oddness of the function y = sin x it is easy to show that when - π / 2 < X < 0
| sin x| < | x | .
Finally, when x = 0
| sin x | = | x |.
Thus, for | X | < π / 2 inequality (1) has been proven. In fact, this inequality is also true for | x | > π / 2 due to the fact that | sin X | < 1, a π / 2 > 1
Exercises

1.According to the graph of the function y = sin x determine: a) sin 2; b) sin 4; c) sin (-3).
2.According to the function graph y = sin x
determine which number from the interval
[ - π /
2 ,
π /
2
] has a sine equal to: a) 0.6; b) -0.8.
3. According to the graph of the function y = sin x
determine which numbers have a sine,
equal to 1/2.
4. Find approximately (without using tables): a) sin 1°; b) sin 0.03;
c) sin (-0.015); d) sin (-2°30").
Functiony = sinx
The graph of the function is a sinusoid.
The complete non-repeating portion of a sine wave is called a sine wave.
Half a sine wave is called a half sine wave (or arc).
Function Propertiesy =
sinx:
3) This is an odd function. 4) This is a continuous function.
6) On the segment [-π/2; π/2] function increases on the interval [π/2; 3π/2] – decreases. 7) On intervals the function takes positive values. 8) Intervals of increasing function: [-π/2 + 2πn; π/2 + 2πn]. 9) Minimum points of the function: -π/2 + 2πn. |
To graph a function y= sin x It is convenient to use the following scales:
On a sheet of paper with a square, we take the length of two squares as a unit of segment.
On axis x Let's measure the length π. At the same time, for convenience, we present 3.14 in the form of 3 - that is, without a fraction. Then on a sheet of paper in a cell π will be 6 cells (three times 2 cells). And each cell will receive its own natural name (from the first to the sixth): π/6, π/3, π/2, 2π/3, 5π/6, π. These are the meanings x.
On the y-axis we mark 1, which includes two cells.
Let's create a table of function values using our values x:
√3 | √3 |
Next we will create a schedule. The result is a half-wave, the highest point of which is (π/2; 1). This is the graph of the function y= sin x on the segment. Let's add a symmetrical half-wave to the constructed graph (symmetrical relative to the origin, that is, on the segment -π). The crest of this half-wave is under the x-axis with coordinates (-1; -1). The result will be a wave. This is the graph of the function y= sin x on the segment [-π; π].
You can continue the wave by constructing it on the segment [π; 3π], [π; 5π], [π; 7π], etc. On all these segments, the graph of the function will look the same as on the segment [-π; π]. You will get a continuous wavy line with identical waves.
Functiony = cosx.
The graph of a function is a sine wave (sometimes called a cosine wave).

Function Propertiesy = cosx:
1) The domain of definition of a function is the set of real numbers. 2) The range of function values is the segment [–1; 1] 3) This is an even function. 4) This is a continuous function. 5) Coordinates of the intersection points of the graph: 6) On the segment the function decreases, on the segment [π; 2π] – increases. 7) On intervals [-π/2 + 2πn; π/2 + 2πn] function takes positive values. 8) Increasing intervals: [-π + 2πn; 2πn]. 9) Minimum points of the function: π + 2πn. 10) The function is limited from above and below. The smallest value of the function is –1, 11) This is a periodic function with a period of 2π (T = 2π) |
Functiony = mf(x).
Let's take the previous function y=cos x. As you already know, its graph is a sine wave. If we multiply the cosine of this function by a certain number m, then the wave will expand from the axis x(or will shrink, depending on the value of m).
This new wave will be the graph of the function y = mf(x), where m is any real number.
Thus, the function y = mf(x) is the familiar function y = f(x) multiplied by m.
Ifm< 1, то синусоида сжимается к оси x by the coefficientm. Ifm > 1, then the sinusoid is stretched from the axisx by the coefficientm.
When performing stretching or compression, you can first plot only one half-wave of a sine wave, and then complete the entire graph.
Functiony= f(kx).
If the function y=mf(x) leads to stretching of the sinusoid from the axis x or compression towards the axis x, then the function y = f(kx) leads to stretching from the axis y or compression towards the axis y.
Moreover, k is any real number.
At 0< k< 1 синусоида растягивается от оси y by the coefficientk. Ifk > 1, then the sinusoid is compressed towards the axisy by the coefficientk.
When graphing this function, you can first build one half-wave of a sine wave, and then use it to complete the entire graph.
Functiony = tgx.
Function graph y= tg x is a tangent.
It is enough to construct part of the graph in the interval from 0 to π/2, and then you can symmetrically continue it in the interval from 0 to 3π/2.

Function Propertiesy = tgx:
Functiony = ctgx
Function graph y=ctg x is also a tangentoid (it is sometimes called a cotangentoid).

Function Propertiesy = ctgx:
How to graph the function y=sin x? First, let's look at the sine graph on the interval.
We take a single segment 2 cells long in the notebook. On the Oy axis we mark one.
For convenience, we round the number π/2 to 1.5 (and not to 1.6, as required by the rounding rules). In this case, a segment of length π/2 corresponds to 3 cells.
On the Ox axis we mark not single segments, but segments of length π/2 (every 3 cells). Accordingly, a segment of length π corresponds to 6 cells, and a segment of length π/6 corresponds to 1 cell.
With this choice of a unit segment, the graph depicted on a sheet of notebook in a box corresponds as much as possible to the graph of the function y=sin x.
Let's make a table of sine values on the interval:
We mark the resulting points on the coordinate plane:

Since y=sin x is an odd function, the sine graph is symmetrical with respect to the origin - point O(0;0). Taking this fact into account, let’s continue plotting the graph to the left, then the points -π:

The function y=sin x is periodic with period T=2π. Therefore, the graph of a function taken on the interval [-π;π] is repeated an infinite number of times to the right and to the left.
In this lesson we will take a detailed look at the function y = sin x, its basic properties and graph. At the beginning of the lesson, we will give the definition of the trigonometric function y = sin t on the coordinate circle and consider the graph of the function on the circle and line. Let's show the periodicity of this function on the graph and consider the main properties of the function. At the end of the lesson, we will solve several simple problems using the graph of a function and its properties.
Topic: Trigonometric functions
Lesson: Function y=sinx, its basic properties and graph
When considering a function, it is important to associate each argument value with a single function value. This law of correspondence and is called a function.
Let us define the correspondence law for .
Any real number corresponds to a single point on the unit circle. A point has a single ordinate, which is called the sine of the number (Fig. 1).

![]()
Each argument value is associated with a single function value.
Obvious properties follow from the definition of sine.
The figure shows that ![]() because is the ordinate of a point on the unit circle.
because is the ordinate of a point on the unit circle.
Consider the graph of the function. Let us recall the geometric interpretation of the argument. The argument is the central angle, measured in radians. Along the axis we will plot real numbers or angles in radians, along the axis the corresponding values of the function.
For example, an angle on the unit circle corresponds to a point on the graph (Fig. 2)

We have obtained a graph of the function in the area. But knowing the period of the sine, we can depict the graph of the function over the entire domain of definition (Fig. 3).

The main period of the function is This means that the graph can be obtained on a segment and then continued throughout the entire domain of definition.
Consider the properties of the function:
1) Scope of definition:
2) Range of values: ![]()
3) Odd function:
4) Smallest positive period:
5) Coordinates of the points of intersection of the graph with the abscissa axis: ![]()
6) Coordinates of the point of intersection of the graph with the ordinate axis:
7) Intervals at which the function takes positive values:
8) Intervals at which the function takes negative values:
9) Increasing intervals:
10) Decreasing intervals:
11) Minimum points: ![]()
12) Minimum functions:
13) Maximum points: ![]()
14) Maximum functions:
We looked at the properties of the function and its graph. The properties will be used repeatedly when solving problems.
Bibliography
1. Algebra and beginning of analysis, grade 10 (in two parts). Textbook for general education institutions (profile level), ed. A. G. Mordkovich. -M.: Mnemosyne, 2009.
2. Algebra and beginning of analysis, grade 10 (in two parts). Problem book for educational institutions (profile level), ed. A. G. Mordkovich. -M.: Mnemosyne, 2007.
3. Vilenkin N.Ya., Ivashev-Musatov O.S., Shvartsburd S.I. Algebra and mathematical analysis for grade 10 (textbook for students of schools and classes with in-depth study of mathematics). - M.: Prosveshchenie, 1996.
4. Galitsky M.L., Moshkovich M.M., Shvartsburd S.I. In-depth study of algebra and mathematical analysis.-M.: Education, 1997.
5. Collection of problems in mathematics for applicants to higher educational institutions (edited by M.I. Skanavi). - M.: Higher School, 1992.
6. Merzlyak A.G., Polonsky V.B., Yakir M.S. Algebraic simulator.-K.: A.S.K., 1997.
7. Sahakyan S.M., Goldman A.M., Denisov D.V. Problems on algebra and principles of analysis (a manual for students in grades 10-11 of general education institutions). - M.: Prosveshchenie, 2003.
8. Karp A.P. Collection of problems on algebra and principles of analysis: textbook. allowance for 10-11 grades. with depth studied Mathematics.-M.: Education, 2006.
Homework
Algebra and beginning of analysis, grade 10 (in two parts). Problem book for educational institutions (profile level), ed.
A. G. Mordkovich. -M.: Mnemosyne, 2007.
№№ 16.4, 16.5, 16.8.
Additional web resources
3. Educational portal for exam preparation ().